

A major challenge to incorporation of data-science into scientific curriculum is that the scientific method (and training) was developed in an environment of data scarcity (Figure 1A). Within biomedical research, this all began to change in the mid-1900’s with the rise of instrumentation and computing technologies that yielded increasingly large datasets, challenging traditional scientific methods. In fact, a 1960 editorial in Science called “Chaos in the Brickyard” specifically anticipated that too rapid data-generation could stifle scientific innovation by overwhelming scientists conceptually. Today, we live in a “big data world” where nearly all fields have access to more information than can be intuitively processed. While the tools of statistics and computer science help us navigate this vast ocean of data, we still need basic scientific frameworks to see the big picture and avoid drowning in the details (Figure 1B). This new tension requires scientists to not only develop new ideas using the scientific method but also to master data science tools to manage the flood of information.
Within biomedical data-science, traditional scientific expertise is even more important than statistical expertise. David Donoho, a statistician at Stanford, argued that discipline-specific knowledge is a critical prerequisite for any work in data science. He emphasized that effective data science requires expertise in various aspects specific to each field, including:
- Scientific knowledge on raw data meaning (e.g. identifying experimental artefacts)
- Scientific knowledge on data transformation (e.g. units conversion)
- Scientific knowledge of physics-based models (e.g., Michaelis-Menten kinetics in Biochemistry)
- Scientific knowledge of data-visualization conventions (e.g. histograms in flow-cytometry/immunology)
- Computing skills (e.g. basic coding, working with clusters)
- Applied statistics skills (e.g. statistical tests, inferential models)
Donoho’s argument underscores the necessity for deep domain knowledge to ensure that data science work is both contextually relevant and technically robust. Traditional doctoral training typically covers the first four points, equipping doctoral students with an ideal foundation to become effective data scientists. With additional basic training in statistics and computing, these students are well-positioned to excel in the interdisciplinary field of data science.
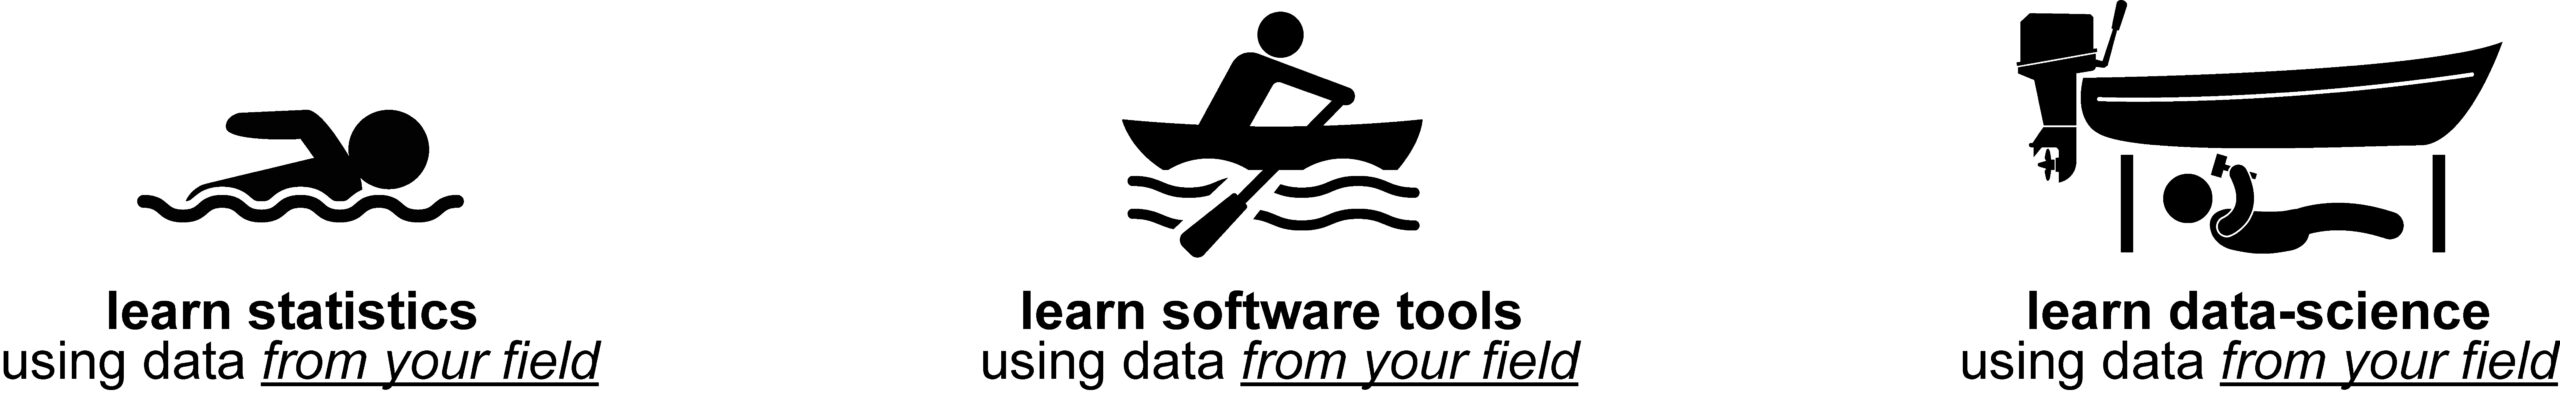
At the University of Georgia, we are employing a multi-pronged approach to equip experimental scientists with the tools of data science. As illustrated using a swimming analogy above, this training focuses on using datasets that are highly relevant to students’ thesis projects to teach both basic statistics and more advanced computational methods. Critically, by leveraging datasets that the students already have an intuitive understanding of from their undergraduate training, we can make basic concepts in statistics and statistical learning more accessible to this audience. This approach ensures that students not only gain proficiency in data science techniques but also apply these skills effectively within their specific scientific domains.
Current Introductory coursework/resources
- College of Pharmacy
- Institute of Bioinformatics
- Institute of Artificial Intelligence
- College of Public Health
PHRM 7210/5210: Introduction to Data-science
To address these challenges, the University of Georgia offers the course PHRM 5210/7210: Biomedical Data Literacy & Applications in R. This course, taught by Eugene Douglass, meets twice a week during the Fall semester of 2024 and aims to develop practical skills in data parsing, visualization, and statistical analysis for commonly used scientific and biomedical datasets. The course is divided into two phases: a skills-focused phase, where students work with pre-processed datasets, and a thesis-focused phase, where students obtain and analyze datasets relevant to their thesis projects. Graduate students are expected to prepare and present brief presentations and final projects based on thesis-relevant datasets, while undergraduates focus on preparation for senior research. This comprehensive course equips students with the tools and knowledge necessary to navigate the complex world of biomedical data.

A major theme of this course is that much of data science involves organizing large matrices to make them easier to navigate. This process is similar to how libraries organize vast quantities of books to make them more useful to the community. Imagine a warehouse filled with unorganized stacks of books—this would be overwhelming for a researcher seeking information on a specific topic. Likewise, raw data matrices can be incredibly challenging to work with, even for data scientists. Therefore, one of the first steps in analyzing a matrix is often to organize the columns and rows into categories, much like a library.
The figure below illustrates this process using a book on gardening in Georgia. The book lists planting months for 40 vegetables commonly grown in the Athens area. I encoded a planting calendar by listing vegetables as rows and months as columns. For each month a vegetable could be planted, I marked a 1 (black box), and for each month it could not be planted, I marked a 0 (white box). Initially, the vegetables were organized alphabetically, making the matrix appear disorganized and confusing. By applying a simple clustering algorithm, we quickly identified vegetables with similar planting schedules and reorganized the rows to reflect these groupings: Spring/Fall vegetables and Summer vegetables. In PHRM 5210/7210, this activity is thoroughly explored to demonstrate the power of (1) encoding raw data from books and papers and (2) organizing that raw data for efficient matrix visualization.
